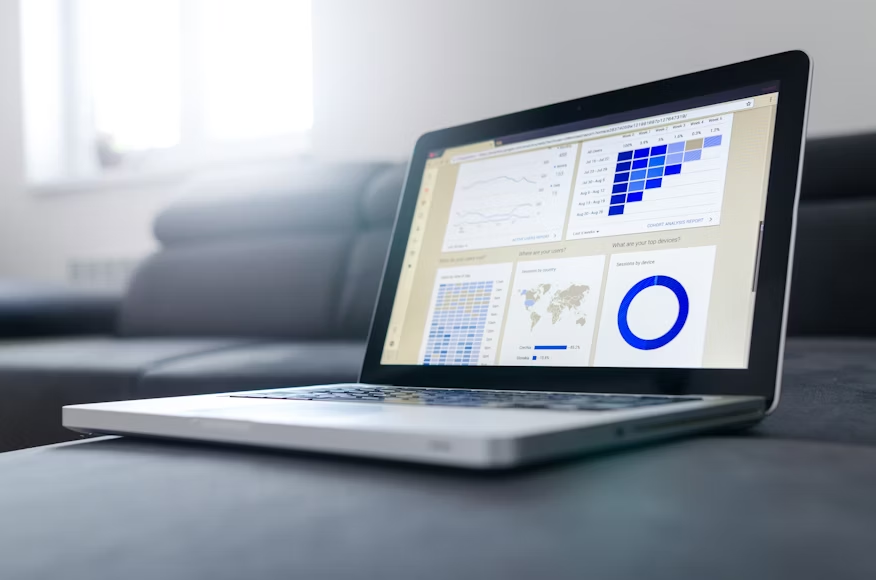
How Data Visualization is Reshaping Property Investment Decisions
Discover how data visualization is transforming property investment decisions, offering clearer insights and smarter strategies for investors.
Data visualization is transforming how real estate investors make decisions. It uncovers patterns, reduces guesswork, and helps compare properties at scale.
As the property market becomes more competitive and data-rich, visual tools have become invaluable in the real estate industry. Investors now demand clarity from complex data, and visualization offers exactly that. This article explores how visual insights are reshaping investment strategy.
From Raw Data to Clear Insight
Investment data comes in various forms, including property values, demographics, rental history, and economic trends. Without a way to synthesize this information, it’s easy to get lost in the noise. Visualization tools bring clarity by turning spreadsheets into meaningful visuals.
Bar charts, heat maps, and scatter plots reveal correlations instantly. You can spot which neighborhoods are appreciating fastest or where rental gaps exist. With the right design, even large datasets become intuitive and easy to scan.
For accurate insights, keep visuals simple. Use consistent color schemes and focus on metrics that influence ROI. Avoid overloading dashboards with too much data. Start with one core question and let the visual guide the answer.
Identifying Market Trends at a Glance
Timing matters in real estate. A strong visual dashboard helps investors track market shifts as they happen. Instead of reading lengthy reports, you can scan a few charts to see where the market is heading.
Heat maps can show demand concentrations by area.
Line graphs reveal historical trends in property prices or rents.
Bubble charts highlight areas with rapid development or population growth.
This visual approach turns reactive planning into a proactive strategy. You can spot opportunities earlier and make more confident decisions.
Risk Assessment Through Visual Models
Every investment carries risk, but data visualization helps investors understand exposure in a clear and fast way. Color-coded maps can show flood zones, economic volatility, or crime rates. Scatter plots can compare price-to-rent ratios and vacancy risk side by side.
One powerful method is layering different data sources onto a single map. For example, you can overlay transit accessibility with rental growth. These layered views help uncover unseen patterns and red flags.
Use benchmarks when visualizing risk. Compare each property against city averages or similar units. This creates context and helps set risk tolerance more objectively.
Enhancing Investor Communication and Reporting
Investors need more than raw numbers. They need to see the story behind the deal. Visualization improves reports, decks, and client updates, making your message clear without needing long explanations.
Dashboards provide live updates on key performance indicators.
Charts help summarize monthly or quarterly performance at a glance.
Interactive visuals allow stakeholders to explore data on their own.
With cleaner communication, teams stay aligned and decisions move faster. Well-designed visuals build trust and reduce back-and-forth confusion.
Tools and Platforms Leading the Shift
The tech behind real estate data has grown rapidly. Platforms like Tableau, ArcGIS, and Power BI are giving professionals new ways to analyze markets. These tools simplify the process of gathering, cleaning, and displaying property data.
Power BI stands out for its flexibility and accessibility. It connects easily to Excel, cloud apps, and CRM systems. Using Power BI for real estate allows investors to track rental income, project appreciation, and monitor expenses through real-time dashboards.
To get started, pick a platform that suits your workflow. Focus on clarity over complexity. Build templates that answer specific questions, and test reports with colleagues or clients before going live.
Conclusion
Data visualization is now essential in real estate investing. It simplifies research, accelerates analysis, and strengthens investor confidence.
By mastering the right tools and presenting data visually, you gain a clearer view of every deal. In a fast-moving market, that clarity is a competitive edge.


